questfox® Instant Report simplifies your market research life
Posted: 13. March 2015 Filed under: Uncategorized Leave a commentThe new reporting features of questfox® Instant Report are appreciated by the first set of users since their launch earlier this year. With only a small set of option you can reach the maximum effect in interactive report.
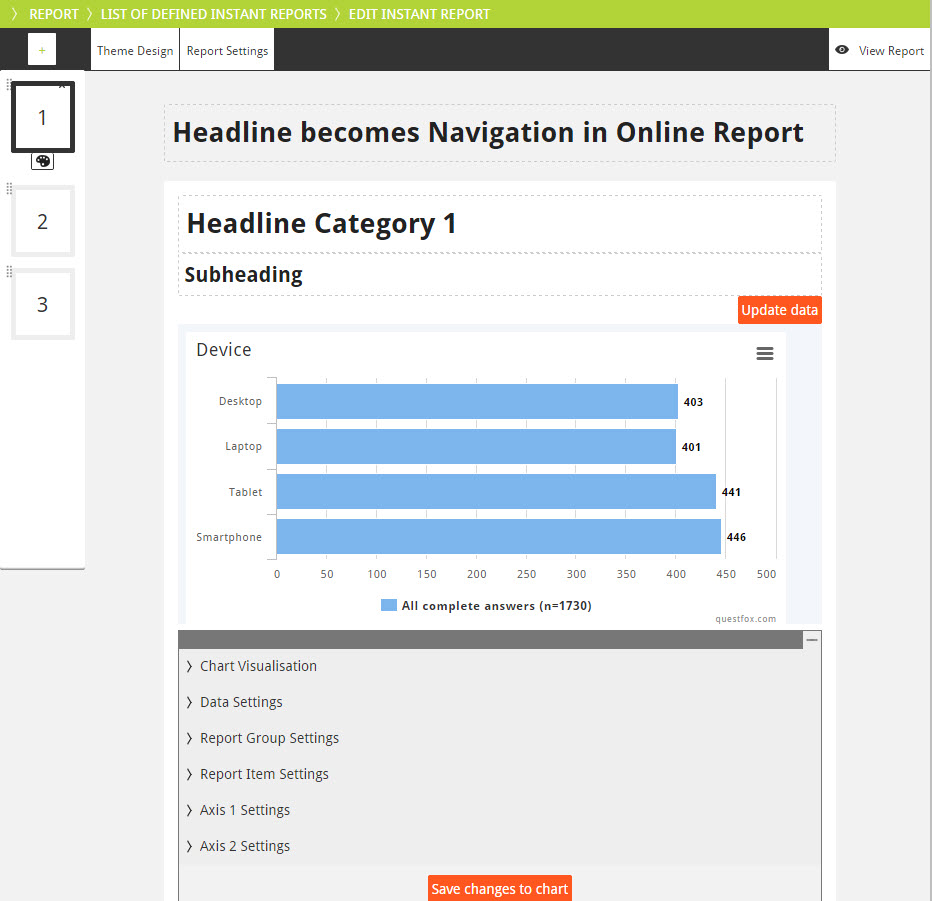
questfox® Instant Report allows you to
- Create a chart based on your collected data
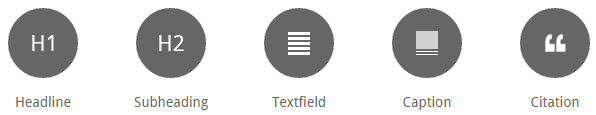
- Implement small or huge amounts of texts in different CSS formats
- Integrate Pictures
- Integrate YouTube Videos in your report
It is as simple as clicking your report together with an incredible amount of options to change the look of your report
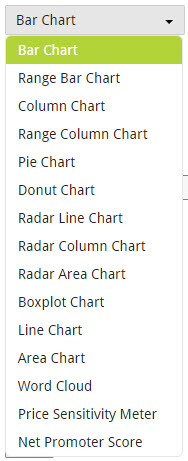
A set of graphic options is available which can easily compete with Excel’s functions of turning data into a graph.
Some of the graphics are set to a specific default representation but can later be changed into other forms. The follwoing options are available:

Add some structure and some content to your report and you have created an Instant Report which can be published online.
Have fun trying to create a questfox® Instant Report.
By the way: Why not create several reports for different target groups based on the same set of data? questfox Instant Report can support you with that kind of tasks with only a few clicks.
Example of a CSS Design for Background Picture of questfox Instant Report
Posted: 11. March 2015 Filed under: Uncategorized Leave a commentIt is possible to create a background picture to make the questfox Instant Report look more appealing:
Just include the following script in the Custom CSS under Theme Design in questfox Instant Report and you will see one background picture framing your report.
body {
background-image: url(“http://questfox.com/user//YOUR_FOLDER/YOUR_SUB_FOLDER/YOUR_FILE.jpg”);
margin:0px !important;
background-size:100%;
background-repeat:no-repeat;
background-position: bottom;
background-attachment:fixed;
background-color:black !important;
background-size:cover;
}
The result may look like this:
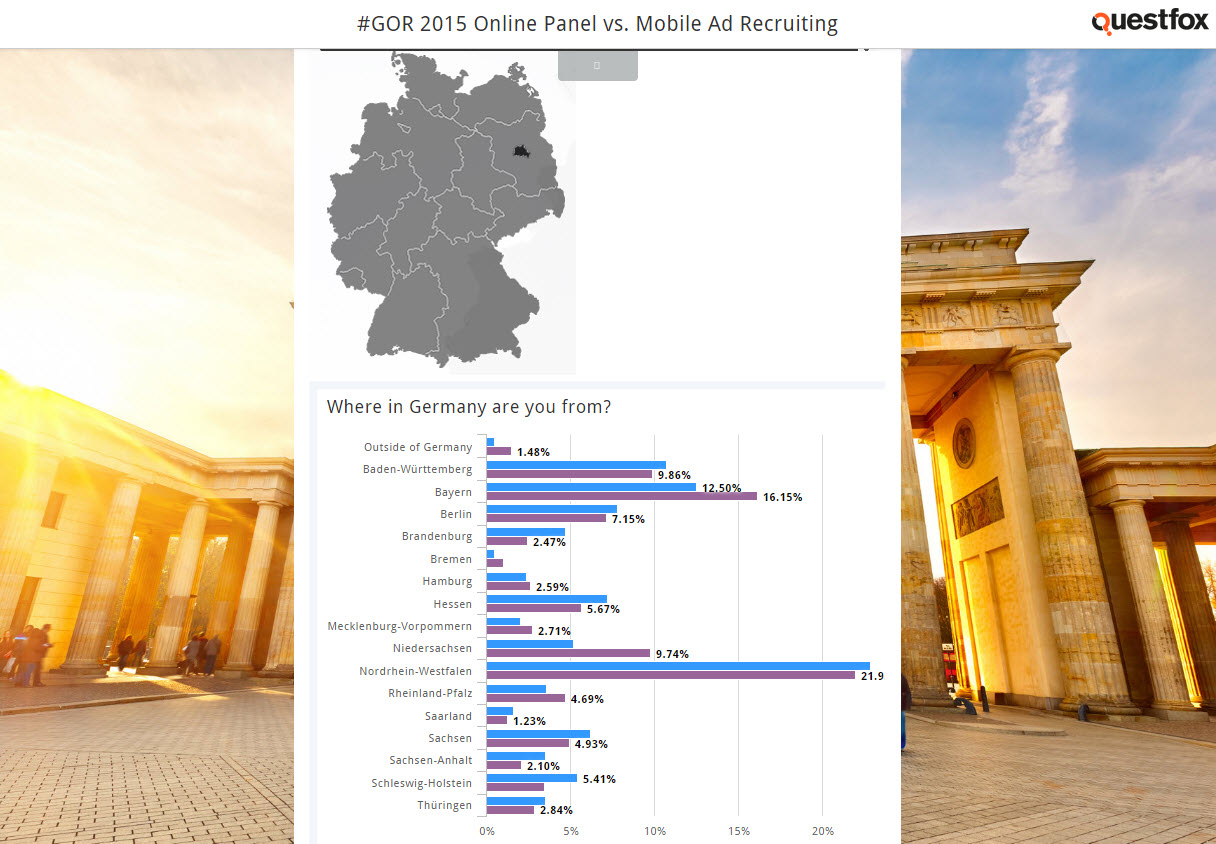
Example of a background picture using CSS with questfox.com
It is also possible to use a picture stored somewhere else. Please make sure that you are not in conflict with anyones copyright when using pictures inside questfox.com.
Live recode available in questfox SaaS market research tool
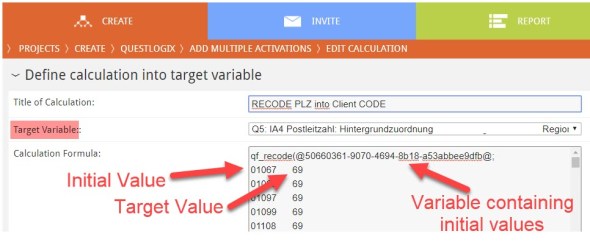
Posted: 8. March 2015 Filed under: Uncategorized Leave a commentThe developing team integrated a new powerful function to recode data inside of questfox. You can recode data while the survey is running into a different variable with a different value. Recoding is implemented in the calculation functions of questlogix.
You need to select your target variable and use the special function qf_recode() with a variable where the data can be found with the idea of a key (which is normally entered by a participant) and a target value to fill your selected target variable.
Example: You want to recode special ZIP Codes into a category:
Define your Target Variable (preferrably an unused variable)
qf_recode(@YOUR_DATA_INPUT_VARIABLE@ ;
key1 value1
key2 value2
key3 value3
key4 value4
key5 value5 ;
defaultValue
)
A defined list can be very long. All answers not in list receive the default value (after the semicolon).
Be carefull when using this powerful recoding function.
Here is an example of how to use than function when recoding the example of a ZIP Code into a specific defined other categorization.
Interactive Map of Switzerland available in questfox.com
Posted: 2. March 2015 Filed under: Uncategorized Leave a commentAn interactive map of Switzerland is now available to all questfox users and their interviewees.
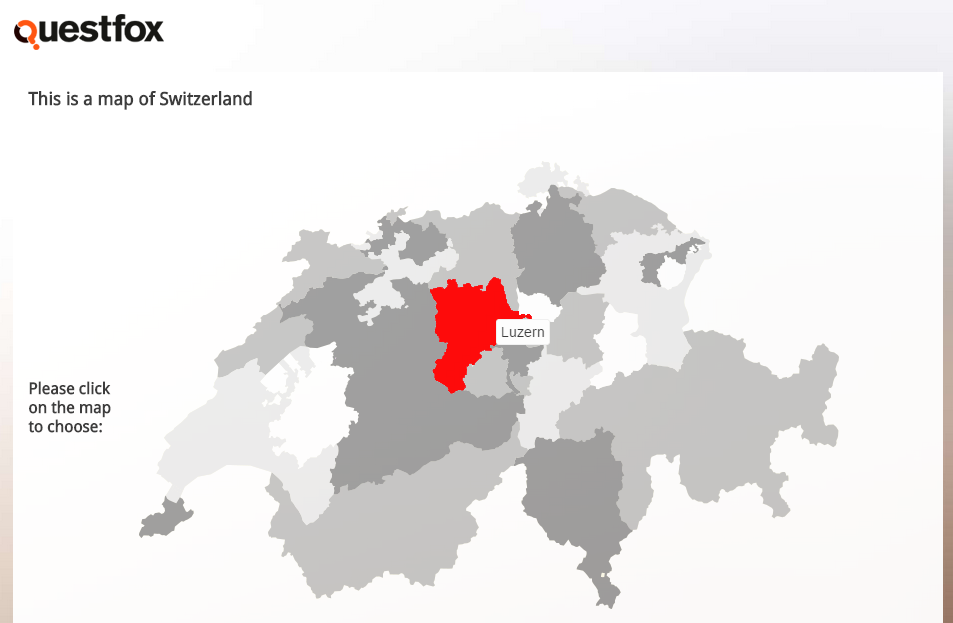
Integration is simple, as the map comes as one of the survey type questions in the SaaS-MR-Tool questfox.com in the category maps. The map works on all devices without any special requirements.

