questfox® Instant Report simplifies your market research life
Posted: 13. March 2015 Filed under: Uncategorized Leave a commentThe new reporting features of questfox® Instant Report are appreciated by the first set of users since their launch earlier this year. With only a small set of option you can reach the maximum effect in interactive report.
questfox® Instant Report allows you to
- Create a chart based on your collected data
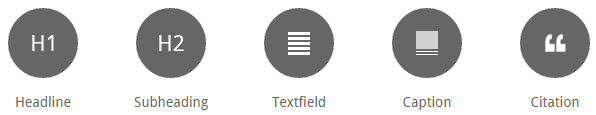
- Implement small or huge amounts of texts in different CSS formats
- Integrate Pictures
- Integrate YouTube Videos in your report
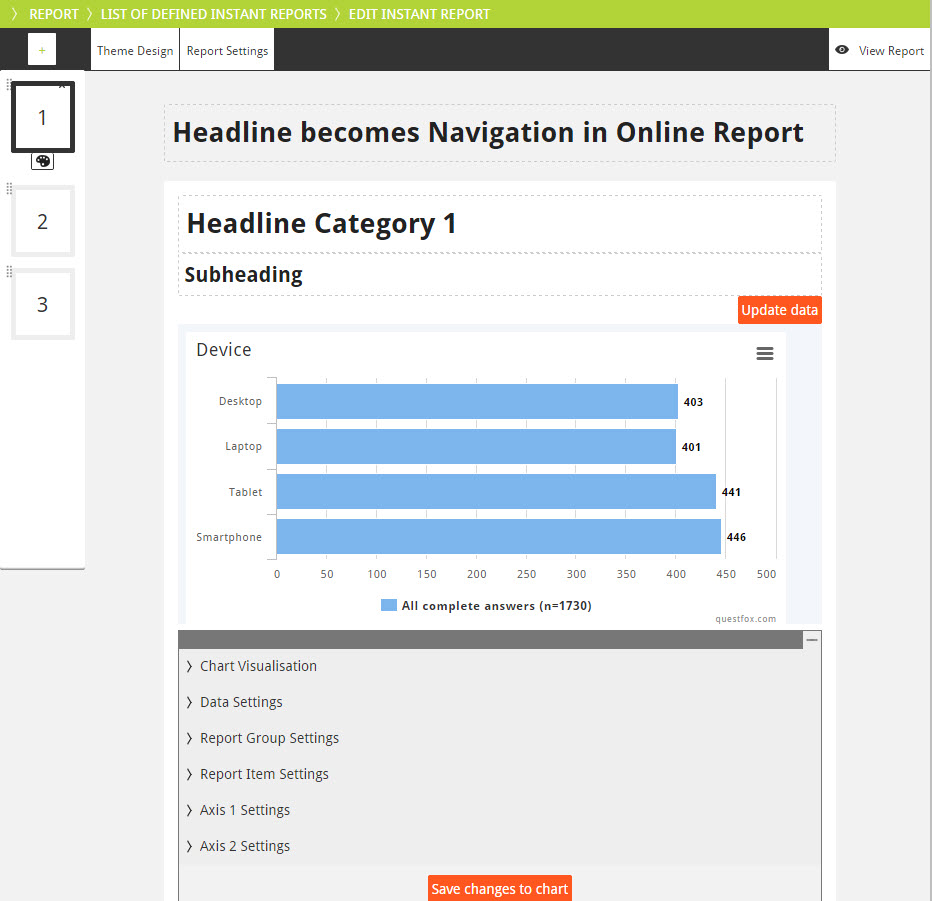
It is as simple as clicking your report together with an incredible amount of options to change the look of your report
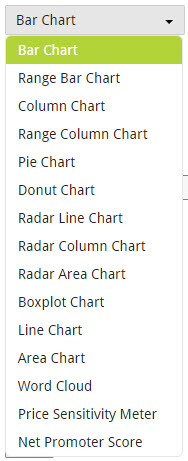
A set of graphic options is available which can easily compete with Excel’s functions of turning data into a graph.
Some of the graphics are set to a specific default representation but can later be changed into other forms. The follwoing options are available:

Add some structure and some content to your report and you have created an Instant Report which can be published online.
Have fun trying to create a questfox® Instant Report.
By the way: Why not create several reports for different target groups based on the same set of data? questfox Instant Report can support you with that kind of tasks with only a few clicks.
