Agile Presentation from Live Data with questfox Living Reports
Posted: 14. July 2021 Filed under: Uncategorized Leave a commentFor years we are promoting the idea of live presentation right from the data collection tool. See our post from 2015.
To be honest we are not really successful as users tend to rely on the idea of downloading and organizing data on their own hard disk.
We are not giving up promoting the idea and we support your agile reporting with some updates in the section of questfox reporting.
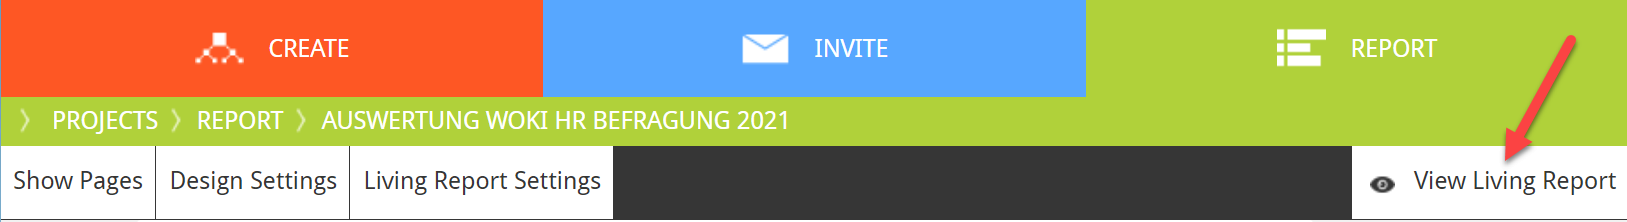
After the definition of your report you can find the View Living Report inside your report.
Every questfox Living Report is organized by the chapter headline. You can right away run into your section or scroll down through your report.
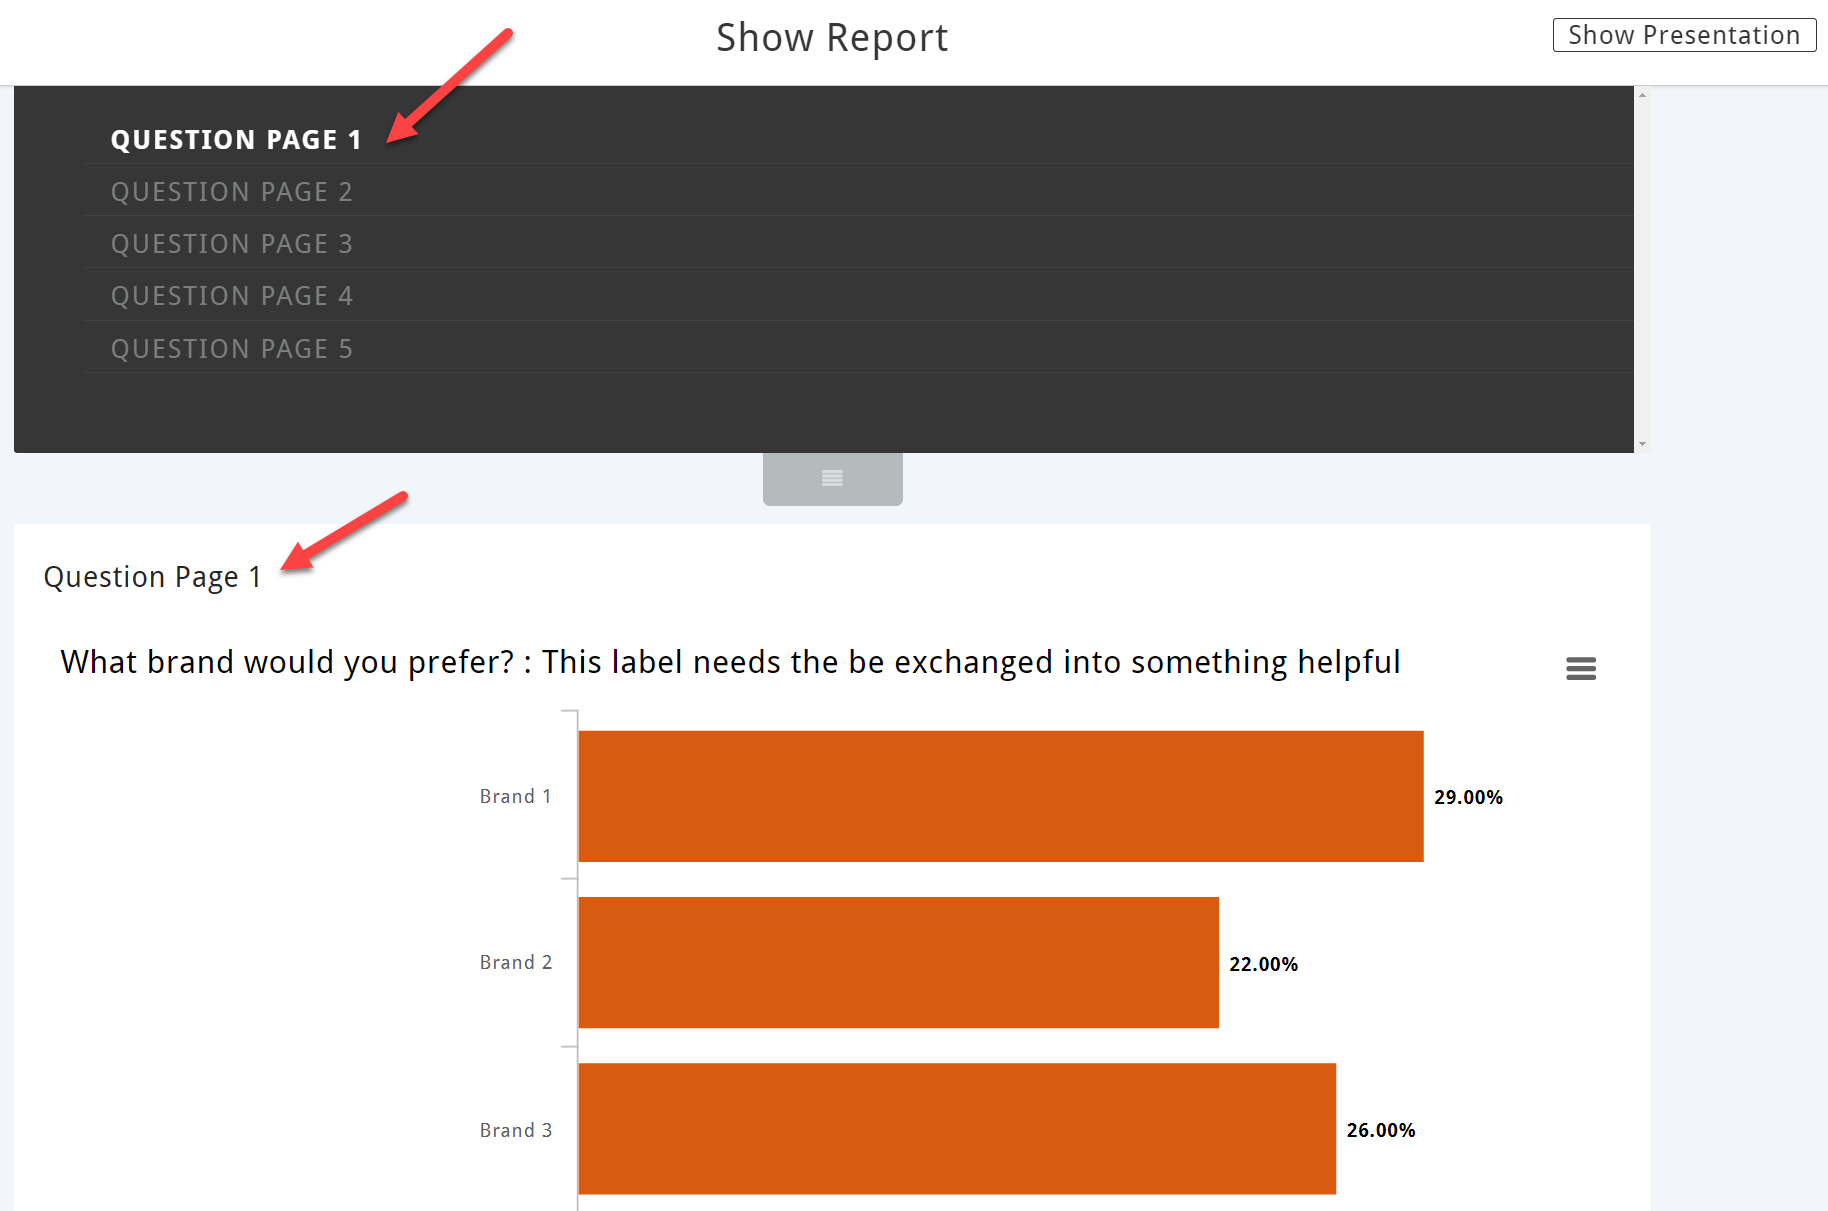
If you plan to show the results to someone please click on Show Presentation
Your report will be presented chart by chart. Clicking on the right side brings you to the next page
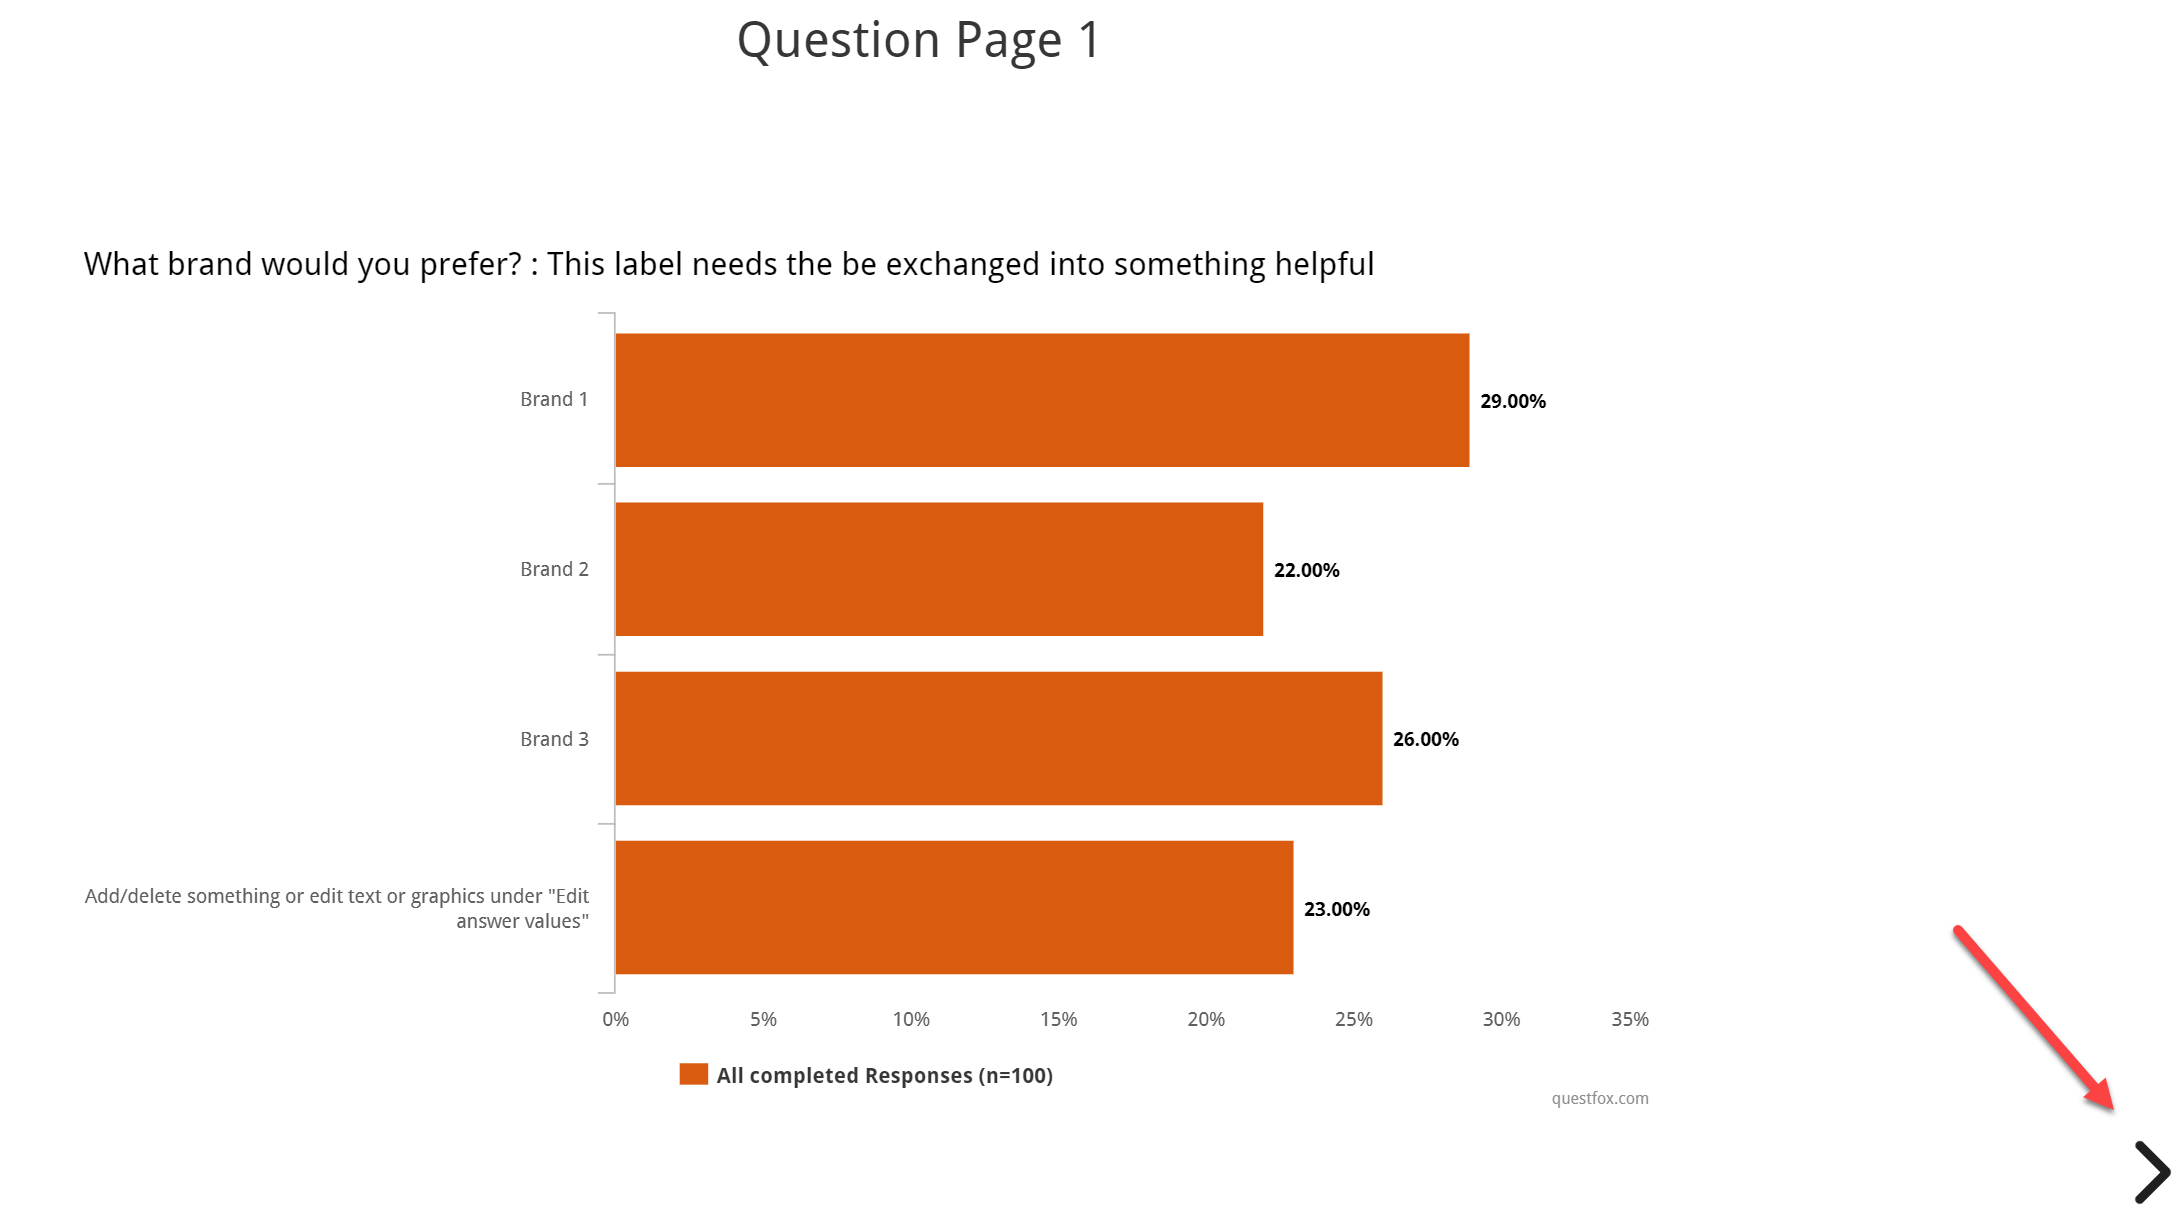
You can move forward and down (in case there is more than one chart on the side) and later back.
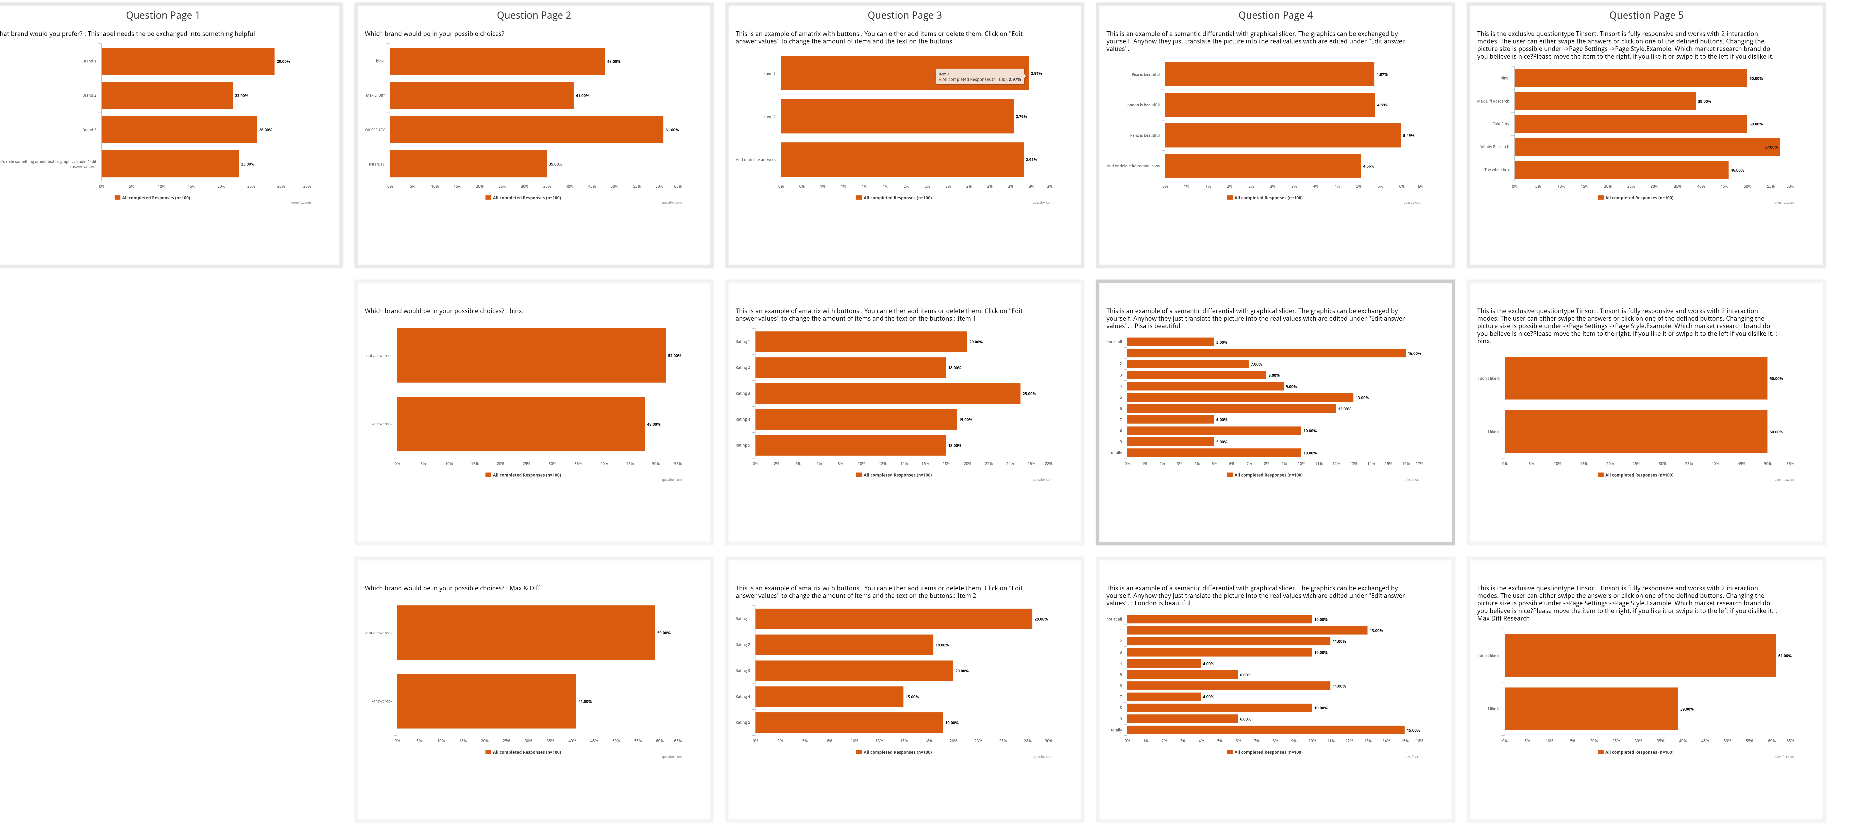
Pressing ESC will bring you to the general overview. From there you can right away click onto the desired slide.
Overview of Living Report

A hint from outside of questfox:
You can set Google Chrome, Internet Explorer, Microsoft Edge, or Mozilla Firefox to full screen mode on a computer, hiding the toolbars and address bar, by pressing the F11 key on your keyboard. To reverse this action and show these items again, press F11 once more. Your presentation will look like a PowerPoint presentation in full screen mode.
Hoping to inspire your research with this supportive toolset.
