IP2Location Maps in questfox Instant Report
Posted: 8. June 2015 Filed under: Uncategorized Leave a commentWith more and more international studies the necessity to control where respondents come from is increasing.
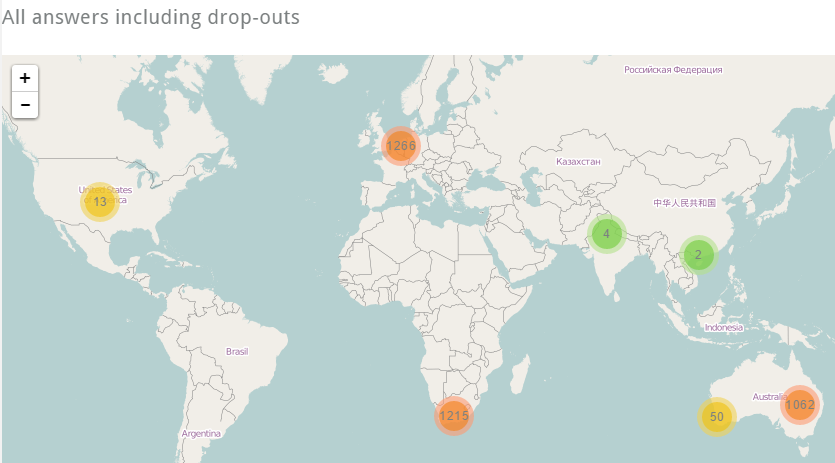
Without analyzing the individual respondent and totally independent from the answers of each respondent questfox is now able to show the location of each respondent on a map. This procedure is respecting the privacy of each individual participant and never combining answers with location information.
The new mapping service is integrated in questfox Instant Report under FIELD REPORT and is replacing the older services which was using Google Maps.
It now looks a little more modern and might look like this.
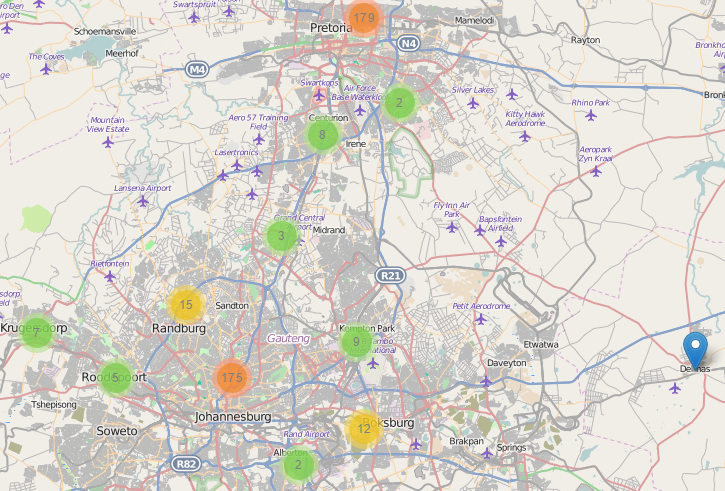
Zooming into a map shows you more details

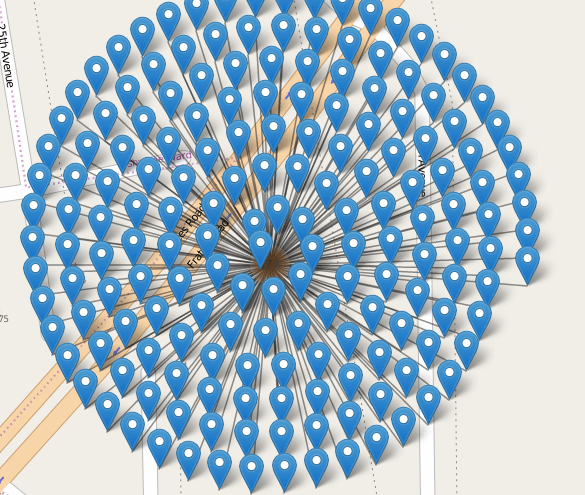
Please remember that IP tracking is never 100% accurate. Especially in the case of mobile participation you might discover funny patterns of participation under the same address like the following
#seriousfun with #questfox
TagCloud Generator available in questfox Instant Report
Posted: 5. June 2015 Filed under: Uncategorized Leave a commentMarket research operates with verbal answers. The problem is always the reporting of those typed-in answers.
questfox Instant Report now offers a set of features to show all responses in one chart. The settings allow you define some standard settings and to exclude words you do not want to see in the list.
As an export function SVG can be very helpful to later manipualte the design in a graphic design tool.
The TagCloud functions are automatically used the moment you try to analyze a question which was asked in a text format. Nothing else to do. #seriousfun with #questfox

Third party analytics tools to be implemented in questfox Instant Report
Posted: 5. June 2015 Filed under: Uncategorized Leave a commentThe questfox Instant Report feature set is thrilling the users all across Europe.
More and more users are actually publishing their reports via social media and other channels.
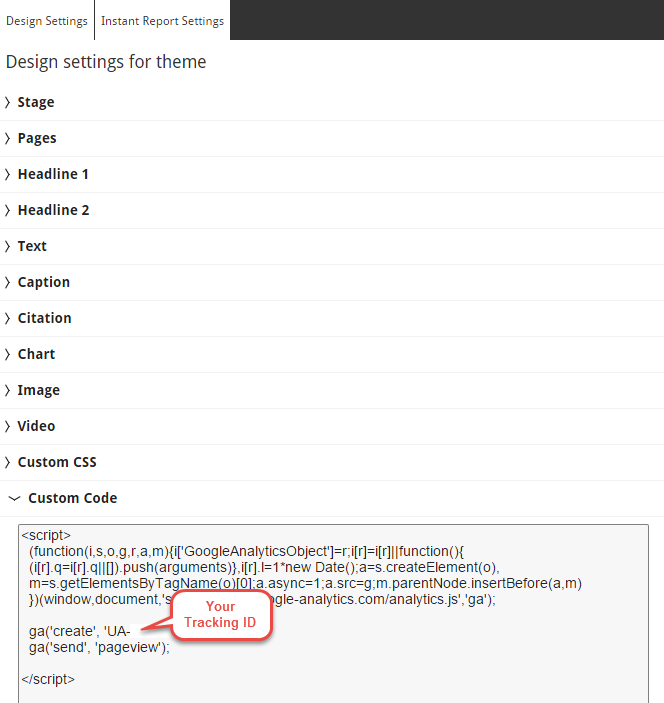
Multiple users requested the chance to integrate an analytics tool to track the success of their published questfox Instant Reports. We now offer the integration of any kind of tracking tool by the function of implementing
The integration is possible inside each distinctive questfox Instant Report by integrating the code of your tracking ID which you normally get from your provider.
Have fun tracking the success of your published reports.
Live field report for different target groups in questfox Instant Report
Posted: 6. May 2015 Filed under: Uncategorized Leave a commentControl about your online fieldwork has never been more convenient.
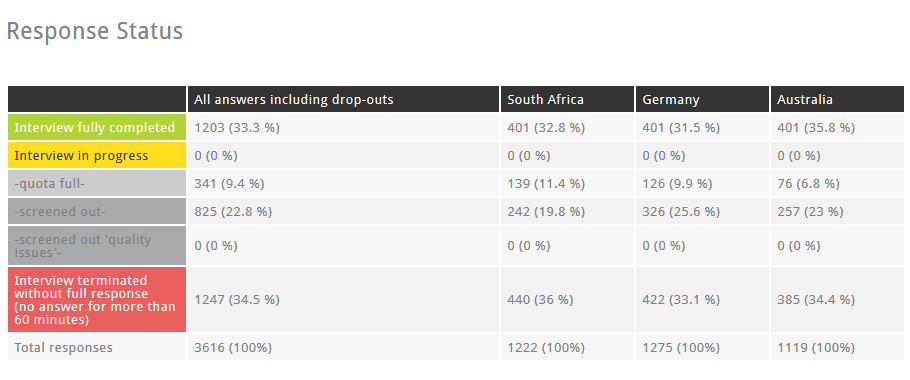
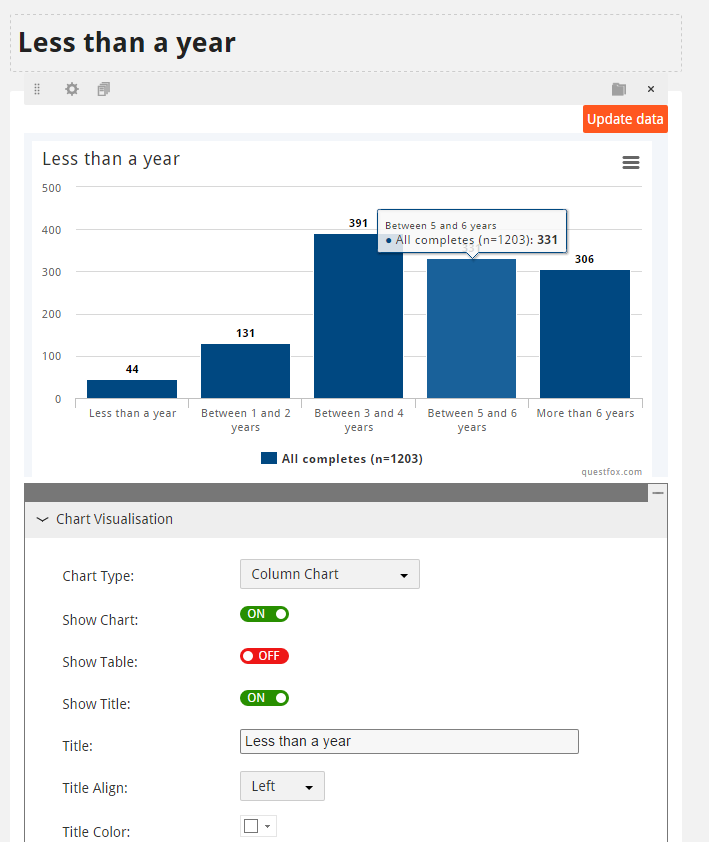
The field report features of questfox Instant Report allow you to have detailed reports on every report group that you defined. The following graph shows the overview from 3 different questionnaires comparing South Africa, Germany and Australia by looking at the different response behaviour of these groups.
How to integrate that into your questfox Instant Report?
Add another “Chart” to your report.
Select “Field Report” and then select the desired report groups.
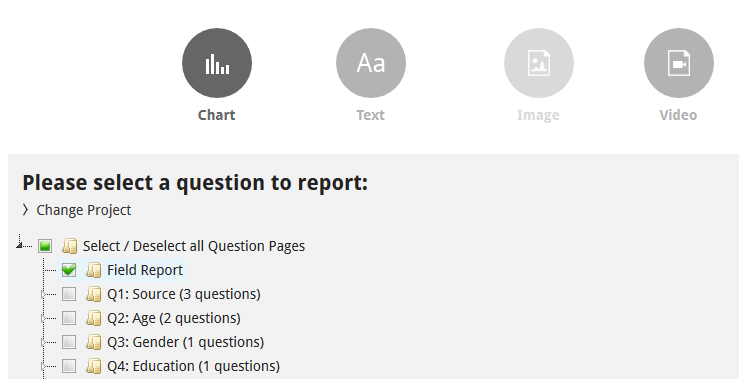
It is as simple as that.
Photoshop-ish features in questfox Instant Report picture manipulation
Posted: 3. May 2015 Filed under: Uncategorized Leave a commentquestfox Instant Report now uses a small set of online picture manipulation tools.
Upload one of your pictures and right click the mouse to see the following menue
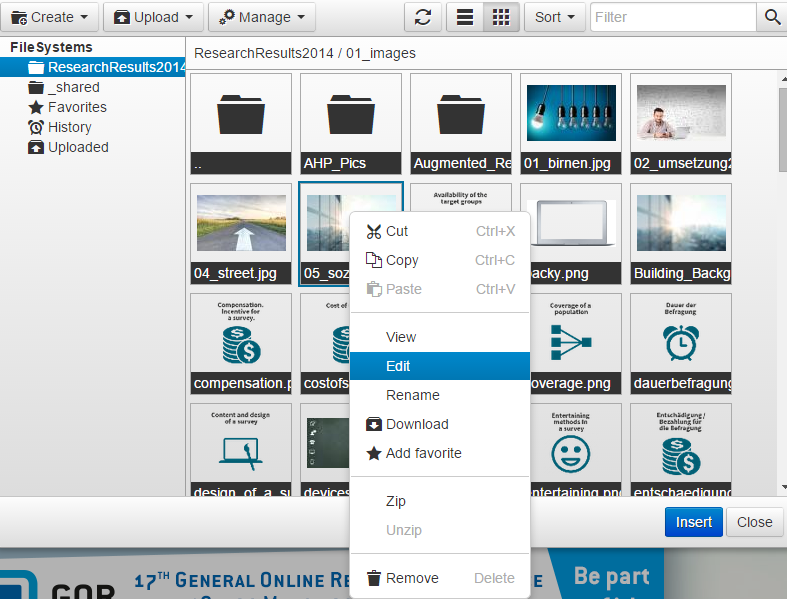
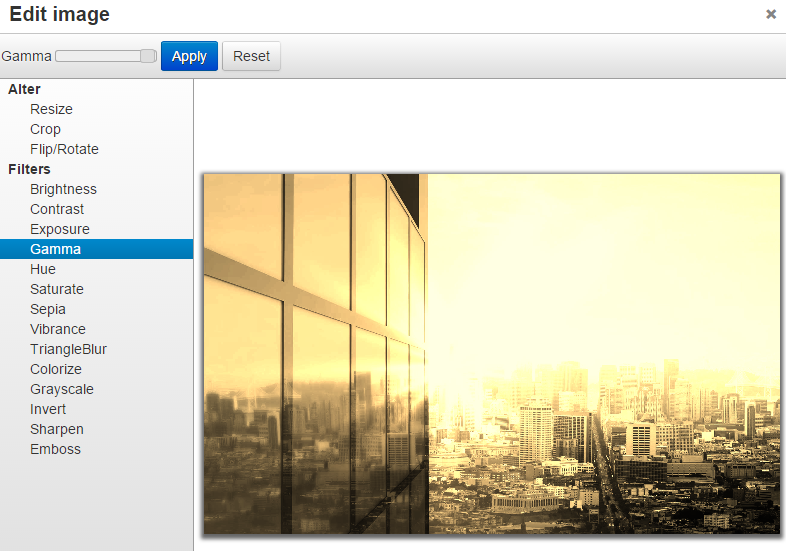
Clicking EDIT allows you to use a small set of manipulation features for the picture
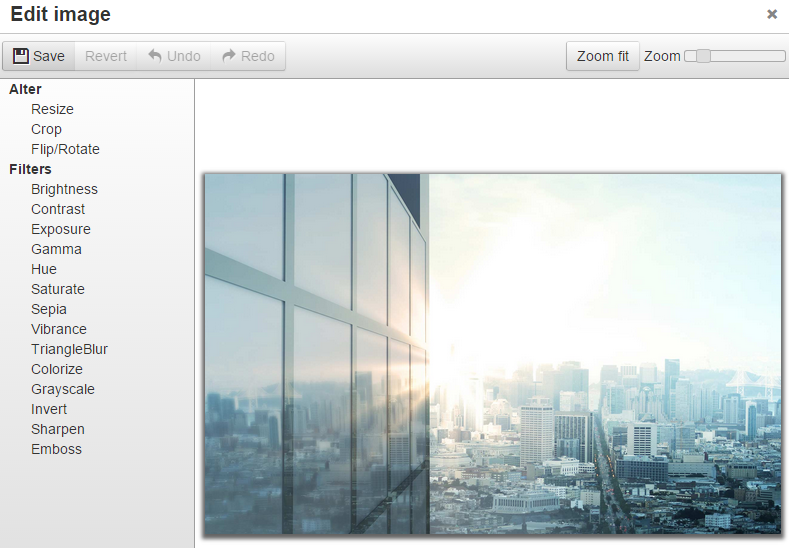
When pressing SAVE you can create a copy of your result in order not to destroy your initially uploaded picture.

Do not forget to press “Apply” once you found your perfect picture settings
This feature should make your life easier and your reports much more beautiful.
Individual Background Pages for each Page in questfox Instant Report
Posted: 1. May 2015 Filed under: Uncategorized Leave a commentquestfox Instant Report now allows to use a different background picture inside every reporting page

You can either select a picture for ALL Instant Report pages or set it individually to every page.
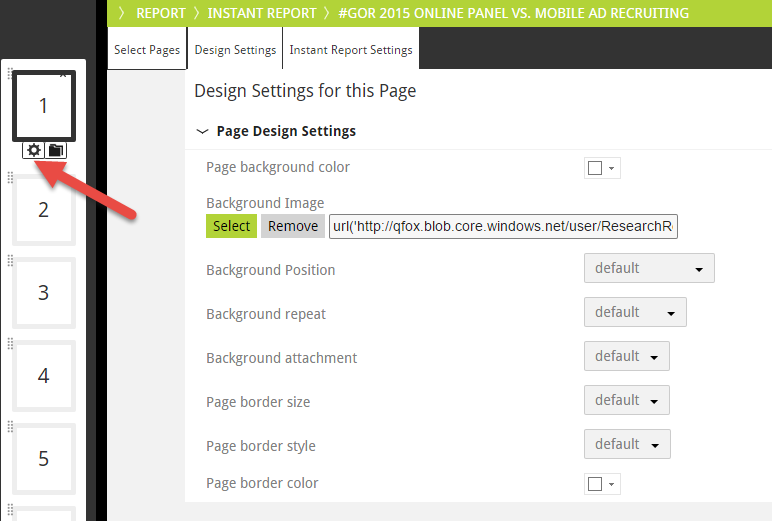
Also test the additional settings for the definition of your background picture. Looking forward to see more colorful reports in the pangea world.
Cross project reporting with questfox Instant Report
Posted: 30. April 2015 Filed under: Uncategorized Leave a commentFrom now on your questfox Instant Report can produce graphics based on different projects of your project space.
Just switch into different projects of your project space and create a chart based on your defined settings.
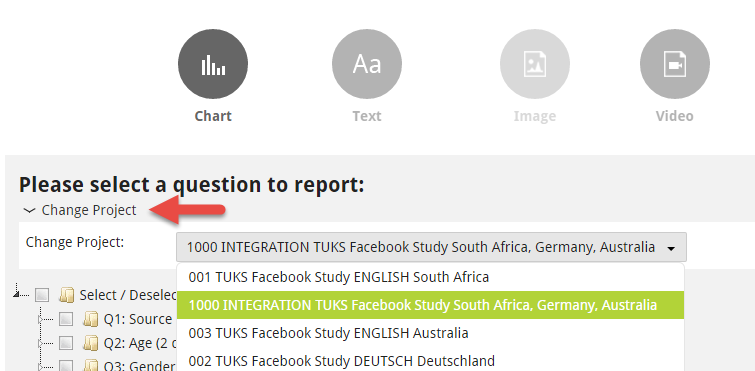
Inside this report you can now integrate all your different project’s graphics.
Design Changes in questfox Instant Report with a design wizard taking over defined formats onto other charts
Posted: 23. April 2015 Filed under: Uncategorized Leave a commentDid you ever create graphical templates that were not the best choice of your professional decision making? It then took hours or days to change this one stupid mistake that was spread across hundreds of graphics. With questfox Instant Report you can easily change ALL the design features with just a few mouse clicks.
1. Set one of the graphics to the target design that you want to use
Change all the settings that you would like to see (and perhaps would like to see on different graphics too)
2. Click on “Paste Format to other Charts”
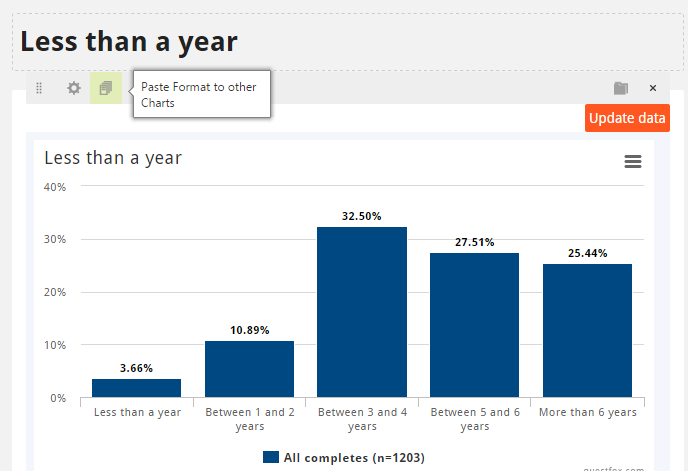
3. Select the format that you want to copy
You now have the option to choose all the design aspects that you would like to see copied from that template chart.

4. Select the design target graphics that should take over your design changes
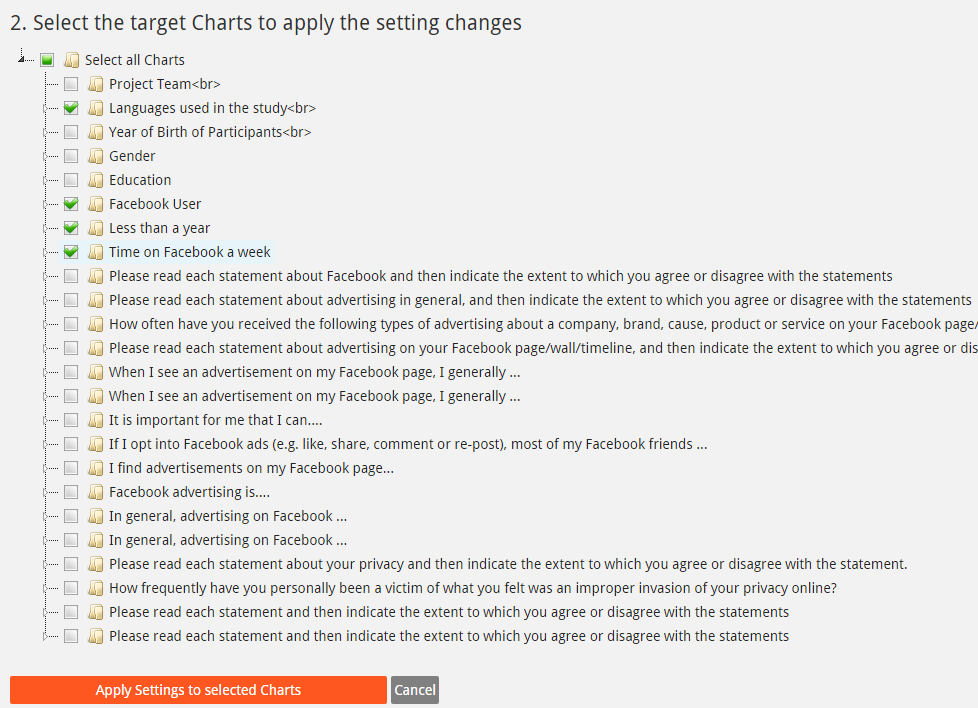
We are still about to test the effects of these marvelous features. We can already tell you: Be careful with those quick changes. Lucky you: You can also take them back in just seconds.
questfox Instant Report Wizard pushes Reporting to the next level
Posted: 16. April 2015 Filed under: Uncategorized Leave a commentAfter intensive tests with more than a hundred beta users, we are proud to announce another major development in the questfox Instant Report feature set. The questfox Instant Report Wizard allows to create entire reports within seconds.
Just select the questions you wish to report and select the split groups as defined in Report Groups. With one click you will receive an Instant Report opening a new Report Page for every question page.
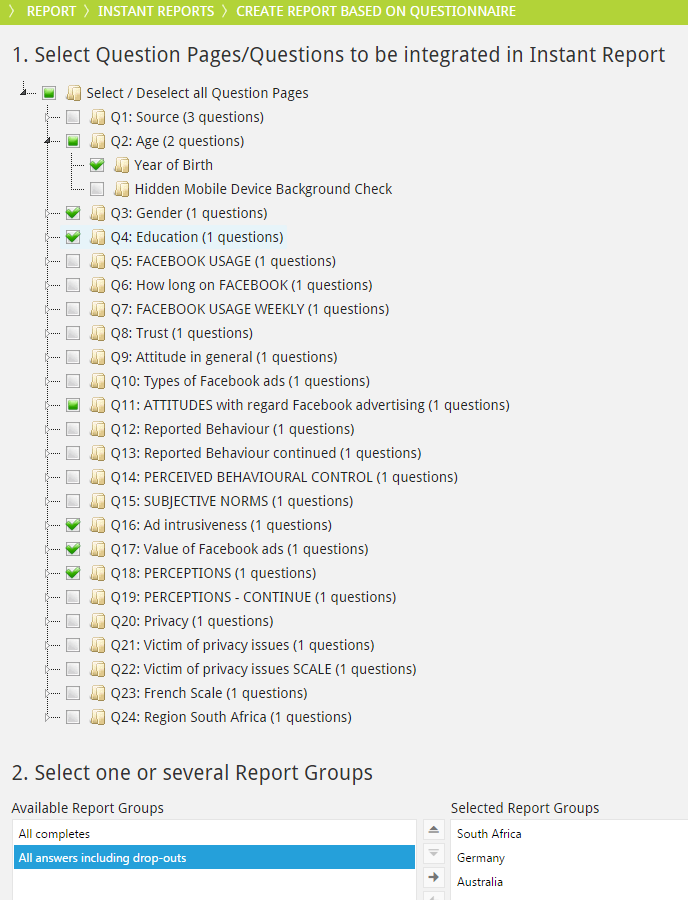
After the definition of the selected question pages / questions you can chose between some basic settings for the entire report. Do not forget to give a distinctive name to your report and press the “Run Instant Report Wizard” button.

The result will be a questfox Instant Report with all your graphics and tables. You can now still change everything according to your wishes.
Also new: Within a page it is now possible to add charts from all parts of the questionnaire into the desired page with a similar wizard. Also figure out the design template features which help you to set up the design for all pages and graphics of your questionnaire.
Have fun producing better reports.
questfox® Instant Report simplifies your market research life
Posted: 13. March 2015 Filed under: Uncategorized Leave a commentThe new reporting features of questfox® Instant Report are appreciated by the first set of users since their launch earlier this year. With only a small set of option you can reach the maximum effect in interactive report.
questfox® Instant Report allows you to
- Create a chart based on your collected data
- Implement small or huge amounts of texts in different CSS formats
- Integrate Pictures
- Integrate YouTube Videos in your report
It is as simple as clicking your report together with an incredible amount of options to change the look of your report
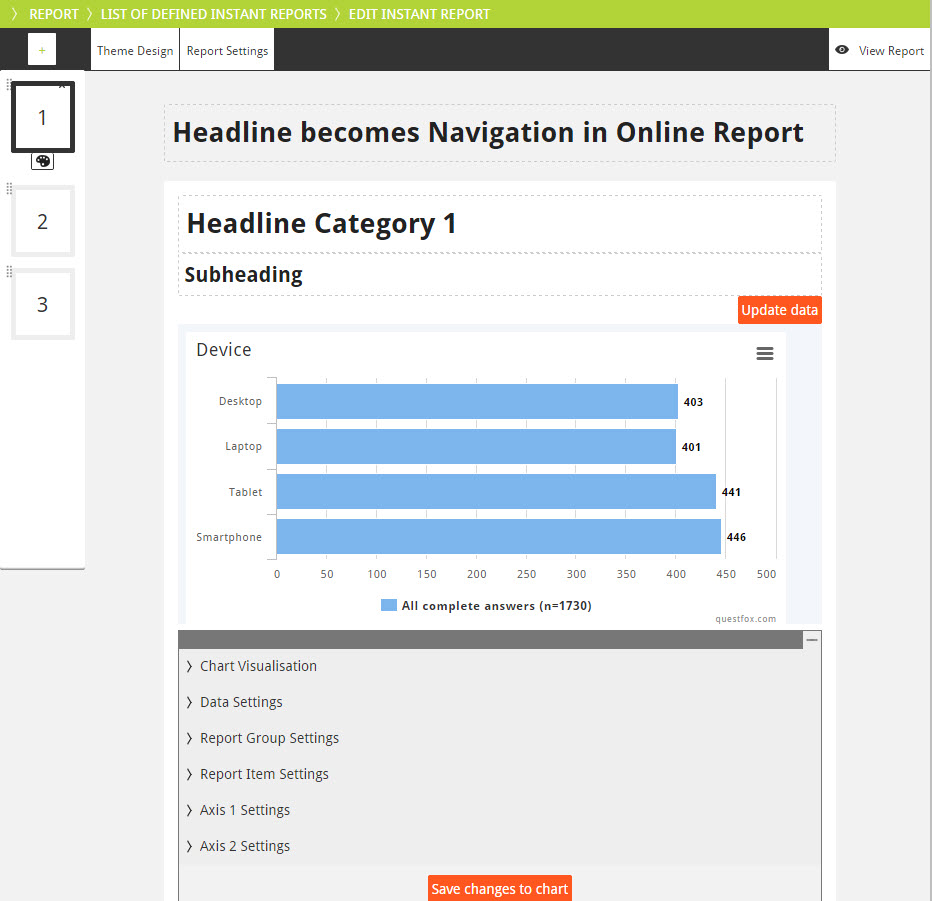
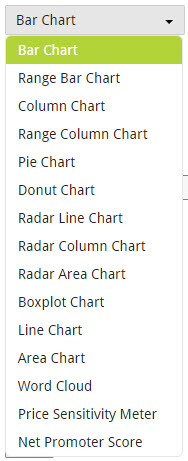
A set of graphic options is available which can easily compete with Excel’s functions of turning data into a graph.
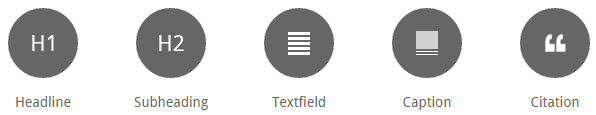
Some of the graphics are set to a specific default representation but can later be changed into other forms. The follwoing options are available:

Add some structure and some content to your report and you have created an Instant Report which can be published online.
Have fun trying to create a questfox® Instant Report.
By the way: Why not create several reports for different target groups based on the same set of data? questfox Instant Report can support you with that kind of tasks with only a few clicks.
