100 simulations possible at once
Posted: 30. August 2013 Filed under: Uncategorized | Tags: simulation Leave a commentThe simulation function in questfox is updated to 100 case each time you run a simulation inside questfox. Simulations are a very helpful tool in order to check your reporting pages before you start inviting to your questfox project.
The function is available under REPORT – RUN SIMULATION


Remember that a simulation is just using random data and is not showing any kind of real data distribution.
Example of Drag and Drop Features in questfox
Posted: 5. January 2013 Filed under: Uncategorized | Tags: Drag n Drop; questfox; pangea labs; FunkyResearch Leave a comment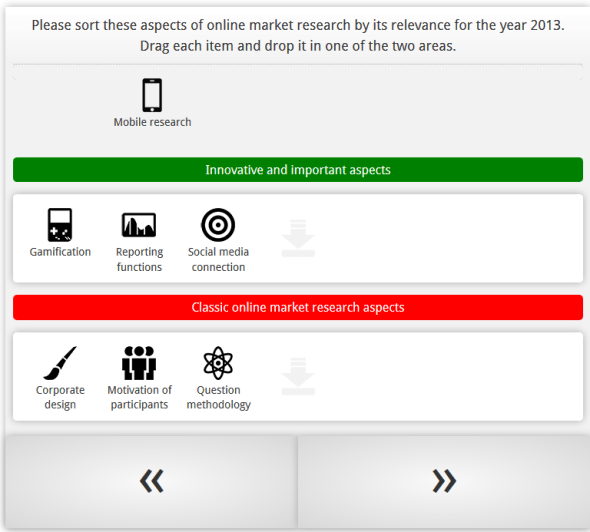
New features of new kinds of mobile research will be available inside questfox soon. Here is an example
Background color in graphical questfox output is set to neutral white now
Posted: 12. December 2012 Filed under: Uncategorized Leave a commentDesign is changing quickly in these days. Windows8 is a real shift in design for several industries.
Today we took away the slightly blue colored background from the questfox graphics.
The inner background is now purely white which should be much less in conflict with a company’s corporate design.
We promise more design changes for the year 2013 in questionnaire design and in output design.
New interactive live online charting tool for decision trees integrated in questfox
Posted: 9. November 2012 Filed under: Uncategorized Leave a commentquestfox allows you to use a new online charting tool in decision trees inside of questfox.

By integrating the command {showTreeChart} into the feedback options of a decision tree, you can easily integrate an interactive graphic while still interviewing.
The following screenshot from an interactive chart shows you how it looks like. Colors are defined by the color of the attribute or alternative.

New function of questfox with online charting tool
We are still in test mode. More graphical reporting upcoming…
Import into Excel right from questfox
Posted: 21. October 2012 Filed under: Uncategorized Leave a commentWe just launched a new import feature, which allows Excel to import selected tables from a questfox report.
The function can be found in

Select the desired group and define the report view.
Then click on:
The link to be used inside of Excel is the external link under “All in one report”
Copy and paste this link into the import function of Excel.
Please remember that this action is heavily consuming server resources and will sometimes take up to several minutes.
Setting the slider position in Semantic Differential questions is available now
Posted: 17. September 2012 Filed under: Usability Leave a commentIt is now possible to define the starting position of a slider in the question type semantic differential inside of questfox.
Go to the settings of the specific question and find the definition of the position underneath the upload of the slider. Every position of a defined scale can be selected.
The screen looks like this:

The question will be then shown during the interview like this:

Setting of a slider on a graphical scale in market research
This setting has no influence on the data situation. Data is only saved, once the slider has been moved to a specific position.
More information about questfox on www.questfox.com
Facebook Fan Check inside of questfox with market research features
Posted: 17. August 2012 Filed under: Technology | Tags: Facebook, Fangate, Foegate Leave a commentWorking in the field of social interaction requires to check a participant’s fan status on Facebook from time to time.
It is now possible to use market research screen-out features inside of questfox based on the Facebook fan status of a person.
The status can be checked using the Quota Management functions in INVITE.

Everyone who is or is not a fan of a defined Facebook page can be automatically be blocked from taking part in the interaction.
These are the settings:
- Type in the name of the facebook fansite (ex. on screen quizfox)
- Set the desired status to check (No Fan equals 0 /Fan equals 1)
- Type in the text for the people who are screened out.


Using this feature would also allow to exclude fans from taking part in a social web (Foegate).
Share your experience with us and www.questfox.com.
![]()
Data calculation: new mean value calculation without missing values as seperate process
Posted: 8. January 2012 Filed under: Technology, Uncategorized | Tags: Update Leave a commentA new function in the data calculation is now allowing to calculate mean values without taking the three different missing values of a variable into account.
The syntax qf_avg(var1 , var2 , var_n) calculates the mean without the defined missing values of each variable into a defined variable.
Because of the intensity of this new function on the database server, the operation is now taking place in a background process.
The registered user will receive an email once the calculation is fully completed. In times of high server load this might take a minute or two.
We will soon integrate this function into questlogix too.
Server Update complete
Posted: 1. January 2012 Filed under: Technology | Tags: Update Leave a commentHappy New Year
The questfox servers have been successfully transfered to a much more performant server environment. All relevant DNS entries are working now.
All the best for your projects.
What’s your quest in 2012?
New Server Online … waiting for DNS entries to be updated
Posted: 31. December 2011 Filed under: Uncategorized Leave a commentThe new questfox server environment is available now.
It will still take some time until the entire internet will have understood the new address (DNS Routing). Re-starting your router might help to get the new IP address.
During the 1st of January 2012 all redirecting issues should be solved automatically. Please check by clicking on your invitation link before you start sending out any questfox links.
We wish you a lot of fun with the new very fast server environment.
Some improvements will follow once the domain transfer is finished.
