#questfox feature alert: Sentiment Sort now available in questfox
Posted: 9. July 2015 Filed under: Uncategorized Leave a commentT
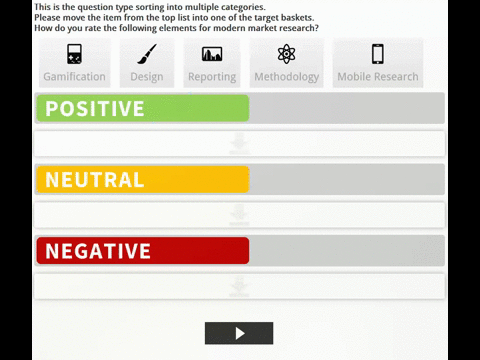
he A new device agnostic feature is available in the SaaS solution questfox. It is now possible to let respondents organize items (graphical or pure text) into a defined set of baskets.
The following animations show the sorting of 5 graphical elements into a set of three targets like in a sentiment analysis.
The development doesn’t stop and we are working of much more cool features to make the market research experience nicer for the millions of respondents out there.
The new question type is available to all subscribers of questfox MR Pro features and is called “Assign items into different categories”. The drag ‘n drop features works on all kinds of devices with touch functionality or mouse usage.
For sure the report is alreasy ready to be reported with questfox Living Reports.
Randomize and Rotation on Page Level now available in #questfox
Posted: 9. July 2015 Filed under: Uncategorized Leave a commentIn a methodogical setting of a questionnaire some researchers would like to randomize or rotate the order of some specific pages of their questionnaire.
Randomizing means to shuffle the defined pages completely while rotation only changes the starting page but keeping up with the order of the pages
This function is now available in questlogix which means that randomization could start after an even complex set of logix.
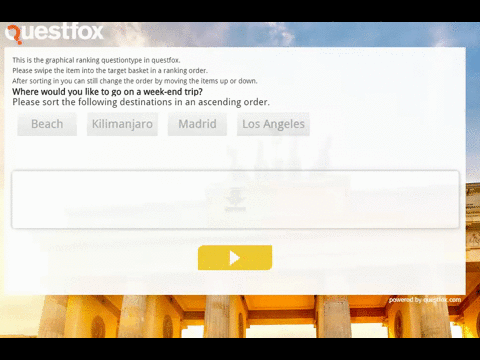
“Ranking” device agnostic question type now available in #questfox
Posted: 8. July 2015 Filed under: Uncategorized | Tags: Device Agnostic Leave a commentThe development of device agnostic question types in questfox continues.
Happy to present “Ranking”. A sorting quetion type designed for touch devices also functional on all other kinds of devices.
Device Agnostic questiontype Sort in ONE in questfox.
This new questiontype also supports graphical items.
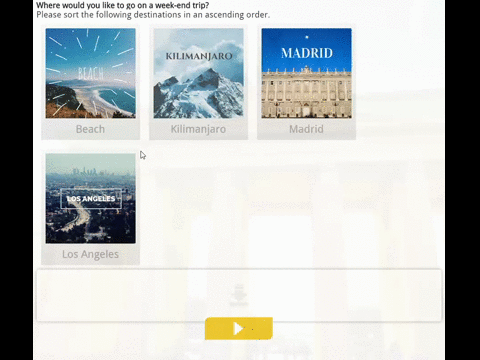
Graphical sorting into one basket
Hope you enjoy the new set of functions with #questfox.
The question type is available for subscribers of the MR PRO features.
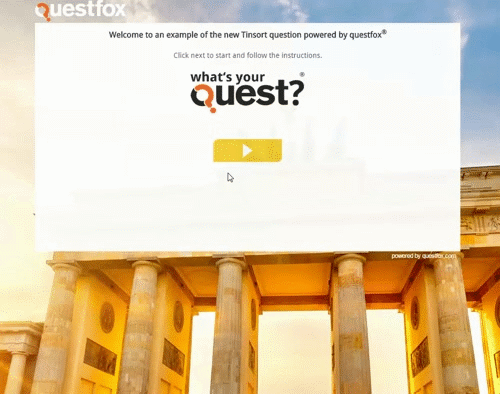
#TinSort a new question type for the world of device agnostic market research available in questfox SaaS
Posted: 1. July 2015 Filed under: Uncategorized Leave a commentThe Mobile Research landscape needs to change. We are using the same kind of questions that market researchers have been using for more than 50 years on all kinds of devices. The questfox development team is trying to change the world of research by combining new kinds of interaction with serious research approaches. #seriousfun
The new questtype called “Tinsort” is so easy to use that everyone would be able to answer market reserach question now.
Tinsort works on all kinds of devices without additional software.
Tinsort is much more fun if combined with the methodology that is implemented in questfox. Our example shows you a combination of a quick rating with Tinsort followed by an analytic decision tree just incorporating the brands that where positively rated in the first place. A live result is right away calculated.
If you would like to try the example live, please click here http://qfxgo.com/l/ej7n86jt
New #paradata functions integrated into questfox SaaS Market Research Tool
Posted: 30. June 2015 Filed under: Uncategorized Leave a commentquestfox now allows the use of additional background tracking information during a survey process on the level of specific question pages. The data collected sums up as “Paradata”. As a fundamental decision we decided not to track everything possible permanently but would allow the researcher to track specific data whenever needed. Researchers might want to learn about the effect of certain question settings to a project and can therefore implement the tracking for specific question types.
The new functions are integrated as a hidden question at the place of your questionnaire where you want to track this.

![]()
The tracking options consist of
- Check for mobile devices
- Position Tracking (when possible and allowed)
- Response Time Tracking on the question page level in seconds
- Behaviour Tracking with answering devices (Mouse mouvements).
questfox Instant Report comes to life: questfox Living Reports
Posted: 17. June 2015 Filed under: Uncategorized Leave a commentWe are proud to announce a milestone in the development of market research reporting: questfox Living Report
questfox Living Report is the next step in our development towards seamless reporting and presentation of market research data without switching between different media forms.
MR Reports tend to be dead by definition. The moment you are printing them the conncection to new information is destroyed.
With questfox Living Report a report is by definition alive and can update itself with data from incoming respondents’ answers.
The functions of questfox Living Report now allows to either start a live presentation or creates a PDF Export of the defined report.
![]()
The new function SHOW PRESENTATION is allowing you to present live from your created questfox Living Report.
Navigating through the presentation can be done with the mouse or the keyboard cursor.
The triangles show you possible ways to go. The slideshow is forwarded by clicking right.

To see an overview of your entire presentation press the ESC key on your keyboard. It will look like this:
See the following video to get an impression about the new feature set in practice.
IP2Location Maps in questfox Instant Report
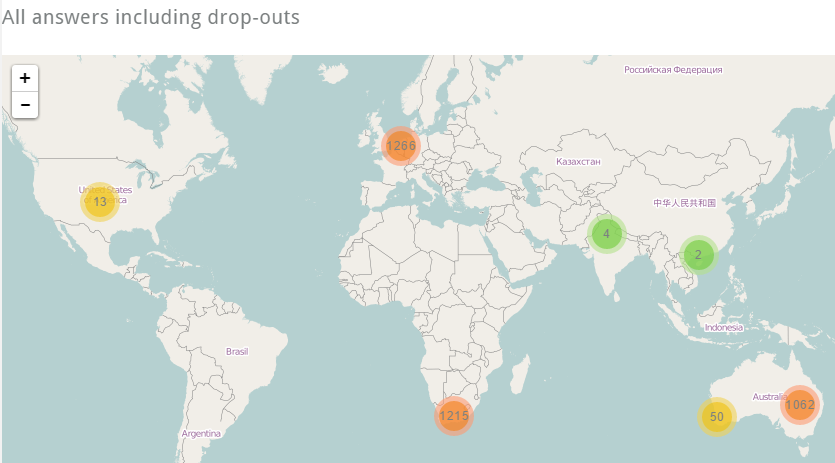
Posted: 8. June 2015 Filed under: Uncategorized Leave a commentWith more and more international studies the necessity to control where respondents come from is increasing.
Without analyzing the individual respondent and totally independent from the answers of each respondent questfox is now able to show the location of each respondent on a map. This procedure is respecting the privacy of each individual participant and never combining answers with location information.
The new mapping service is integrated in questfox Instant Report under FIELD REPORT and is replacing the older services which was using Google Maps.
It now looks a little more modern and might look like this.
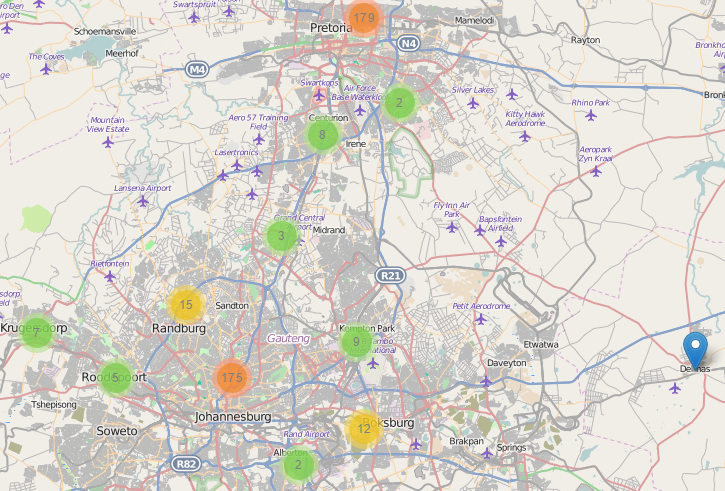
Zooming into a map shows you more details

Please remember that IP tracking is never 100% accurate. Especially in the case of mobile participation you might discover funny patterns of participation under the same address like the following
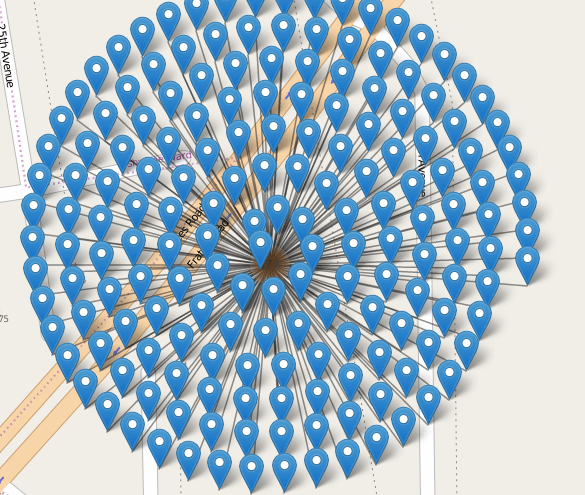
#seriousfun with #questfox
TagCloud Generator available in questfox Instant Report
Posted: 5. June 2015 Filed under: Uncategorized Leave a commentMarket research operates with verbal answers. The problem is always the reporting of those typed-in answers.
questfox Instant Report now offers a set of features to show all responses in one chart. The settings allow you define some standard settings and to exclude words you do not want to see in the list.
As an export function SVG can be very helpful to later manipualte the design in a graphic design tool.
The TagCloud functions are automatically used the moment you try to analyze a question which was asked in a text format. Nothing else to do. #seriousfun with #questfox

Third party analytics tools to be implemented in questfox Instant Report
Posted: 5. June 2015 Filed under: Uncategorized Leave a commentThe questfox Instant Report feature set is thrilling the users all across Europe.
More and more users are actually publishing their reports via social media and other channels.
Multiple users requested the chance to integrate an analytics tool to track the success of their published questfox Instant Reports. We now offer the integration of any kind of tracking tool by the function of implementing
The integration is possible inside each distinctive questfox Instant Report by integrating the code of your tracking ID which you normally get from your provider.
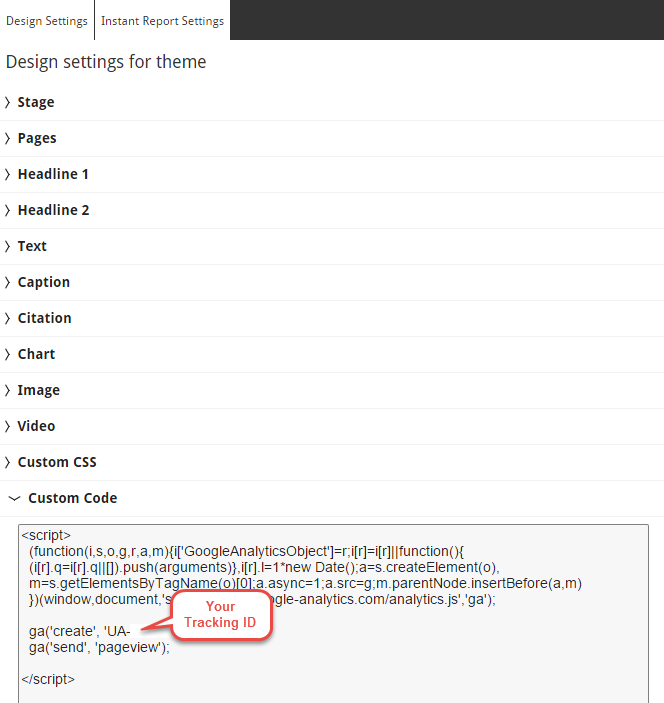
Have fun tracking the success of your published reports.
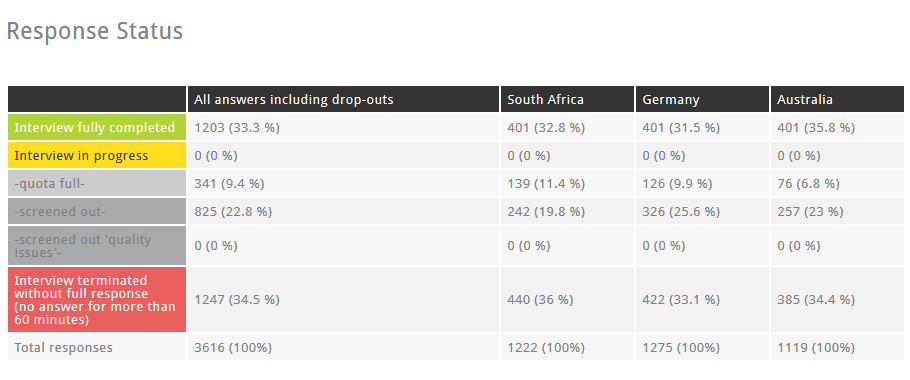
Live field report for different target groups in questfox Instant Report
Posted: 6. May 2015 Filed under: Uncategorized Leave a commentControl about your online fieldwork has never been more convenient.
The field report features of questfox Instant Report allow you to have detailed reports on every report group that you defined. The following graph shows the overview from 3 different questionnaires comparing South Africa, Germany and Australia by looking at the different response behaviour of these groups.
How to integrate that into your questfox Instant Report?
Add another “Chart” to your report.
Select “Field Report” and then select the desired report groups.
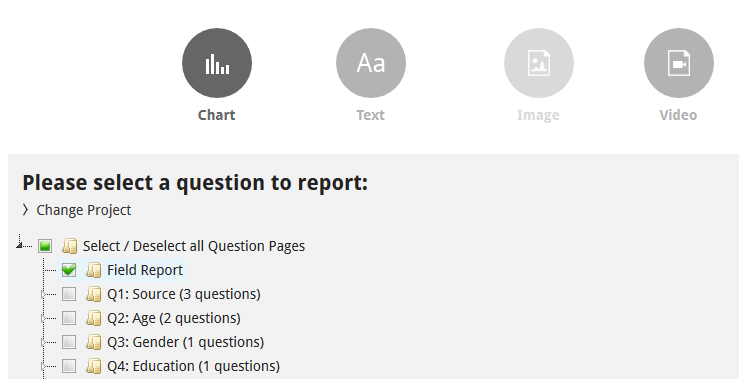
It is as simple as that.
